How Dollar Cost Averaging affects Portfolio Performance
Article last updated: July 12, 2022
Dollar Cost Averaging is one of the most popular strategies for investors around the world. Many claim that Dollar Cost Averaging helps reduce risk one overpay for an asset before the price of such an asset drops. In this article, we discuss the rationale behind the DCA methodology and how it impacts an investment performance. If you find this article helpful, don’t forget to share it with your fellow investors. If you also think that tracking your investment strategy is useful and want to track it regularly and effortlessly, visit us at Portseido.
The purpose of this article is to show how Dollar Cost Averaging affected portfolio performance in the past. Nothing contained in this article should be construed as investment advice.
What is Dollar Cost Averaging?
Dollar Cost Averaging, also known as DCA, is an investment strategy that tries to minimize the risk of overpaying for any asset by dividing the invested capital into same small amounts and periodically investing that amount into an asset over time instead of one lump sum investment.
In this way, investors are able to buy more in the period when the price is low and buy less shares when the price is high. Moreover, DCA helps avoid market timing which many investors consider counter productive. As an example, we look at how DCA impacts a portfolio performance in 2008 as shown below. In this example, we use $SPY (SPDR S&P 500 ETF Trust) as the main asset to be invested.
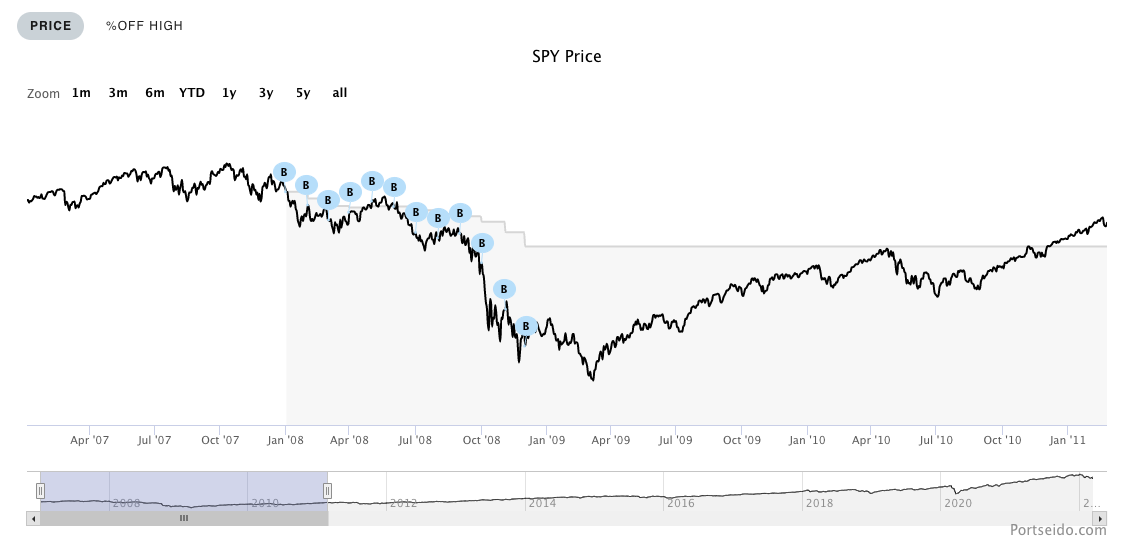
An investment of $10,000 in $SPY at the beginning of 2008 (just ahead of stock market crash) would result in $32,783.62 today. This is equivalent to +227.84% return or +8.76% annualized return. On the other hand, an investment of $10,000 with monthly DCA over 12 months of 2008 would result in $38,628.44 today or +286.28% return or +10.03% annualized return.
The difference in returns is due to the fact that with DCA an investor was able to buy more shares of $SPY during the financial crisis instead of buying it at the highest during the bubble. Moreover, since investors were averaging down during the crisis, DCA also reduced the maximum drawdown in 2009 as well. With DCA, the maximum drawdown experienced during 2009 was reduced to -43.91% compared to -51.13% without DCA.
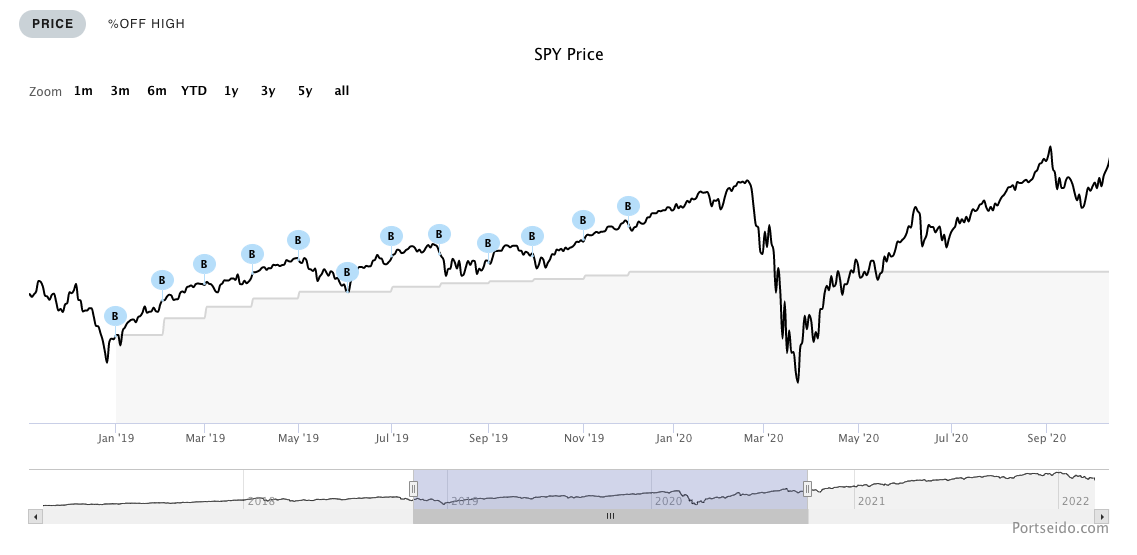
On the other hand, in 2019 when the market recovered strongly, DCA did worse in every metric since an investor was buying less shares during the bullish market. With monthly DCA, an investment of 10,000 would give $15,184 today or a return of +51.84% (+14.05% annualized return) compared to 17,445.64 or a return of +74.46% (+19.17% annualized return) without DCA. As shown, DCA yields different results based on the market condition investors are in.
In the next section, we zoom out to compare what really happened when investors deployed their whole capital with DCA and without DCA at different times since 1994. To simplify things, we simulate the results by comparing two scenarios, investing $10,000 at the beginning of any given year against doing a monthly DCA over the same year. The results are shown below:
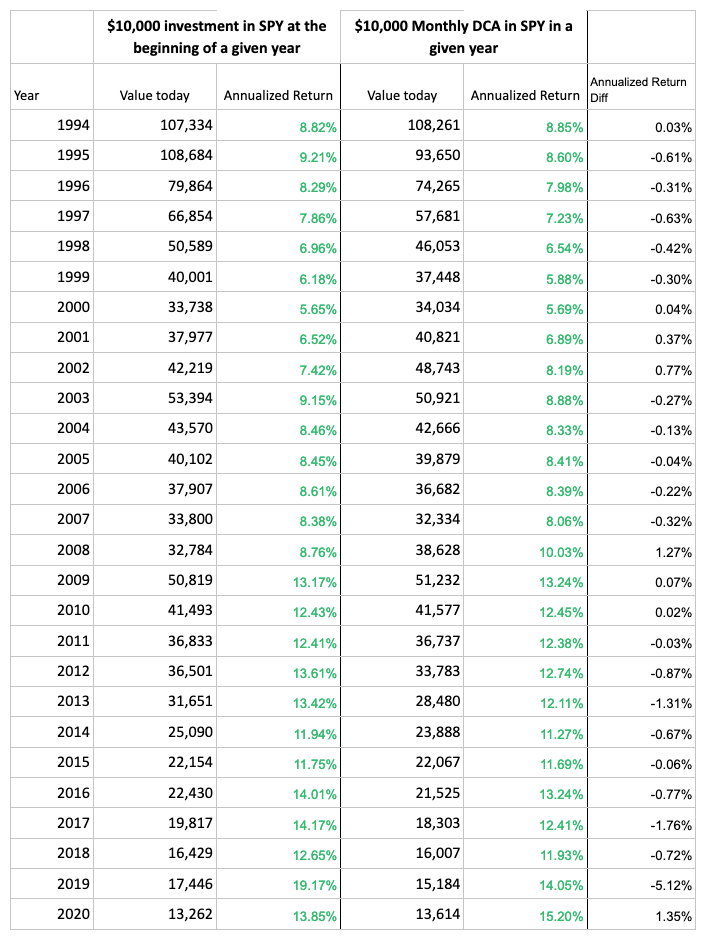
To summarize the table above, the average annualized return without DCA is +10.42%, and with DCA it is +10.02%. On an aggregate, there is not much difference in the return perspective. Furthermore, if we exclude the recent years (2017-present) which still have a short time horizon and can overstate the annualized return, the difference is even smaller with +9.63% and +9.44% respectively.
You might wonder what is the benefit of DCA at this point. To answer this question, we have to look deeper at three of these data points. A DCA based strategy shines most during 2002, 2009 and 2020 when the stock market retracted sharply at the time. By using DCA, performances based on drawdown are much better as shown below.
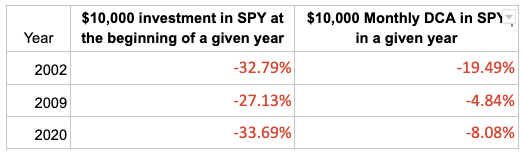
In conclusion, what DCA has achieved is that it helps investors avoid an extreme. Buying assets at their highest price is always painful for investors. DCA helps make such scenarios less likely. As a result, investors were able to achieve average return while being able to reduce the drawdowns significantly.
If you like the cool charts and graphs in this article, be sure to check out Portseido. We make tracking your portfolio and performance simple, so you can focus on what’s important. Invest, Measure and Learn.