What is Beta and what does it mean for investors?
Article last updated: October 27, 2022
What does Beta mean?
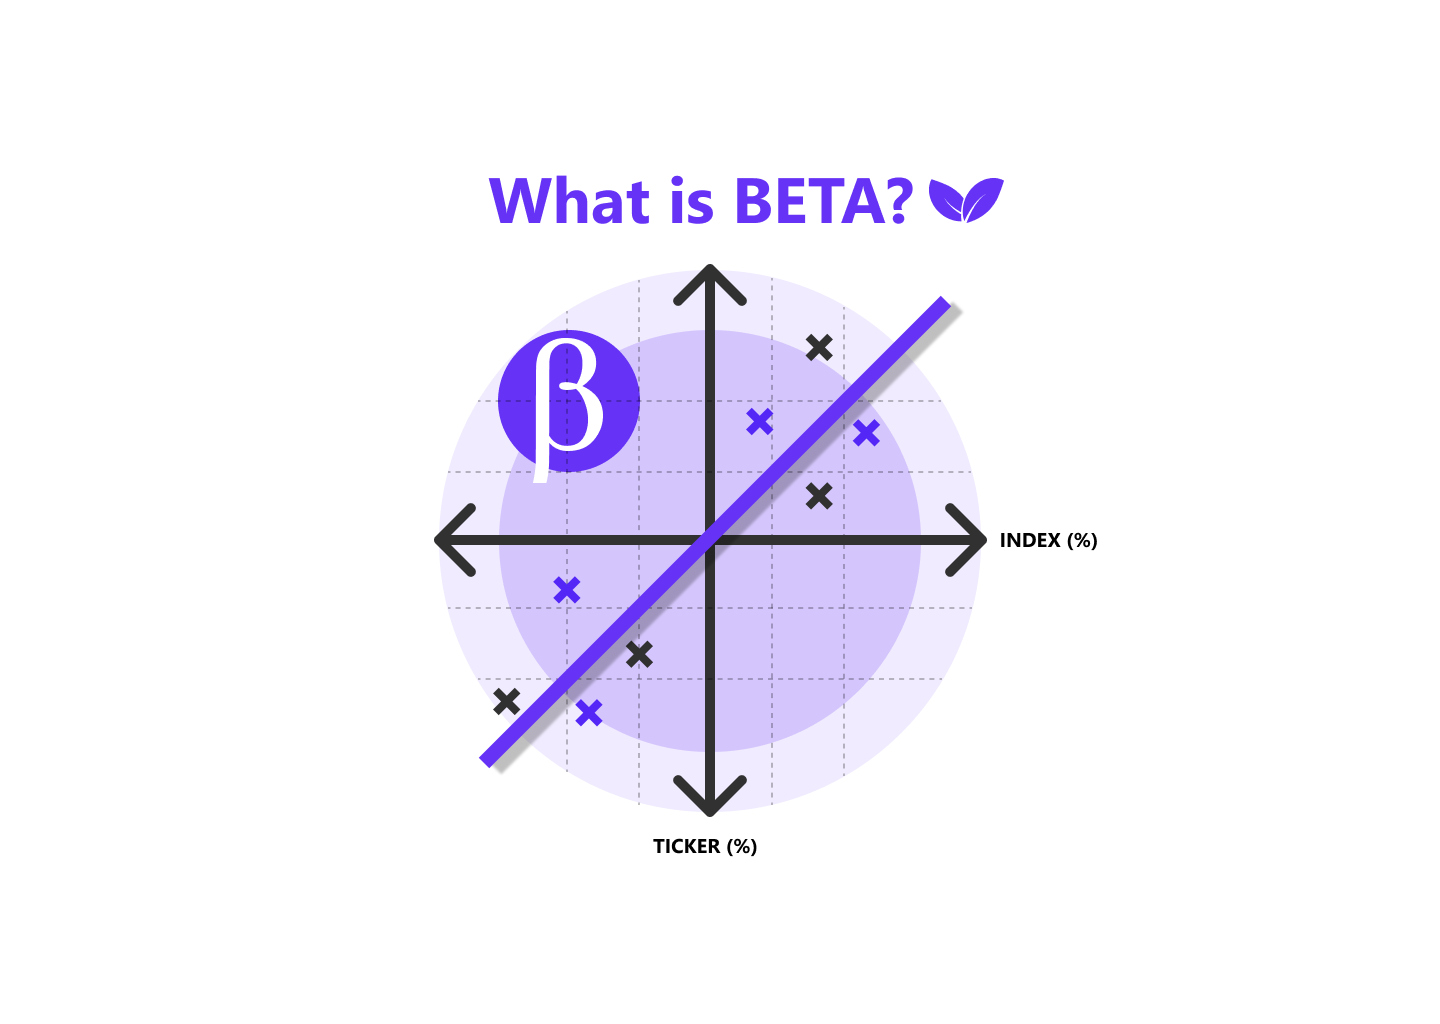
Beta (β) is one of the risk measurements for a stock or portfolio by measuring the volatility of the asset or portfolio compared to the market. It is originally used in the Capital Asset Pricing Model (CAPM) to calculate expected returns of an investment. In this article, we will first dive into the CAPM, Beta, its implication to investors and lastly its limitations.
Capital Asset Pricing Model (CAPM)
CAPM is a model intended to estimate the expected return of an investment by assuming a linear relationship between the risks and the returns. This means if the asset’s risk is higher, the return that an investor should expect will be higher too. The CAPM formula states that:
Expected Return = Risk-free Rate + Risk Premium
The formula states that, by investing in a risky asset, the expected return will be equal to the return of the risk-free asset plus the premium the investor should receive from bearing more risk over risk-free asset. Risk-free rate is the rate of return on the risk-free asset which is theoretically assumed to be a short-term government bond. Risk premium is an extra expected rate of return by bearing more risk. Therefore, the risk premium should behave in a way that this risk premium should be low in a low risk asset and should be high in a high risk asset. Beta is playing a critical role in calculating such a premium.
Beta
As stated above, the key of the CAPM is Risk Premium.
Expected Return = Risk-free Rate + Risk Premium
Expected Return = Risk-free Rate + Beta x Market Risk Premium
Expected Return = Risk-free Rate + Beta x (Market Return - Risk-free Rate)
As shown in the formula above, risk premium in any given investment is calculated as relative to market risk premium. Market risk premium is an additional return the investor should expect by investing in the market. This means if one stock is two times riskier than the market, the risk premium should be two times the market risk premium too. To quantify the risk of an investment, CAPM uses volatility of the asset’s return as a measurement of risk. This means the more volatile the asset’s return is, the riskier the asset. The value that shows how risky the investment is relative to the market is “Beta”.
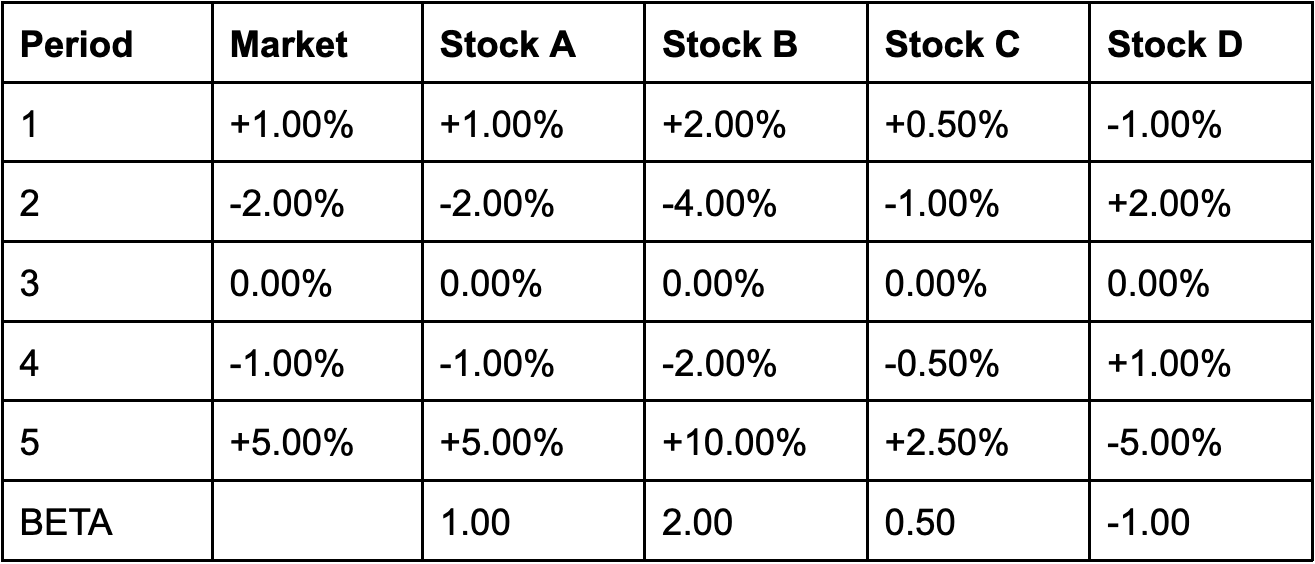
In the example above, we have simplified the number to make it more understandable. While beta of a stock or portfolio can take any value from very negative number to super high positive value, we can look at three cases for interpretation
1) Beta > 1:
Stock with beta > 1 means that when the benchmark is up, it tends to move up even more. For example, Stock B with beta = 2.0 means that if the benchmark is up x% in a period, it on average will go up 2 times as much. Good examples of this type of stocks are high-growth stocks.
2) Beta < 1
On the other hand, stock with beta < 1 means that when the market is up, it tends to move up as well but not as much. For example, Stock C with beta = 0.5, means that if the benchmark is up x% on a day, it on average will only go up 0.5 times as much. An example of low beta stocks are utility stocks.
3) Beta < 0
Negative beta, by definition, refers to a scenario when the stock, portfolio, or investment strategy tends to move in an opposite direction with the benchmark as shown in the table as Stock D.
Beta Calculation
So how is beta calculated exactly? The mathematical formula for computing beta is as follows
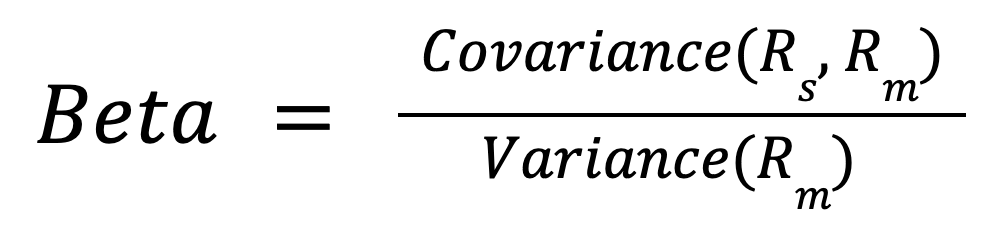
Where R_s = return of an asset or portfolio, R_m = return of a benchmark or market, Covariance is a statistical measurement that captures how much two data tends to move in the same direction.
In practice, these values are usually estimated from historical data by running a regression on the actual data of benchmark return vs stock return as shown in (1). As a result, they can vary from time to time as the relation between the return of stock and market can change and fluctuate as well.
Limitations
Although beta has been in the financial world for a long time. There are downsides on the method in measuring risks.
Firstly, as Beta is estimated from historical data, it might not hold true for predicting the future, so one should bear in mind such limitations when inferring risk from it or trying to forecast future expected return using Beta. For example, a company might change its strategy to use more debt in financing their operation. This action might make its stock return more volatile in the future. By using historical data to estimate Beta, it might misrepresent the risk in this case.
Secondly, Beta infers return volatility as risk which might not represent the ideal definition of risk for investors (risk of permanently losing the capital). The limitation of volatility as risk can be shown in the sample below.
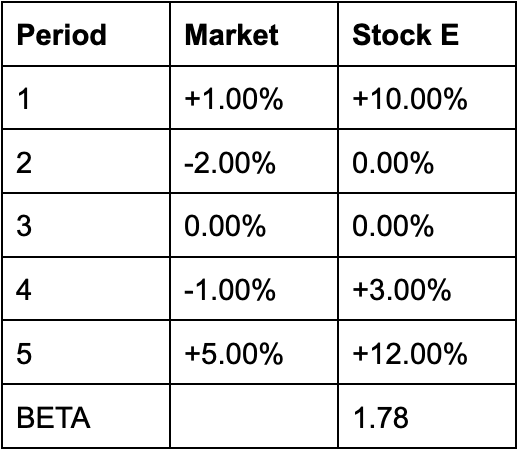
As shown, Stock E has outperformed the market for all periods and has never yielded any negative return in any period. Yet it has a beta of 1.78. Is Stock E riskier than the market? Beta alone might not be able to answer the question.
In the end, Beta is just a measurement of an investment’s return sensitivity relative to its benchmark’s. Although it is not the best measurement of an investment risk since the historical risk might not infer the future and the return volatility might not imply the real investment risk, it can help characterize the asset or the investment portfolio.
Calculating Beta by yourself can be troublesome. Let us do that for you, so you can focus on what really matters. Visit us at Portseido.