Calculate and plan dividend income for your dividend growth portfolio
About this Dividend Portfolio Calculator
In dividend investing world, there are multiple factors impacting the portfolio. This dividend calculator is intended to incorporate those factors into the calculation and visualize it in the simplest way, so you can plan your portfolio ahead and achieve your goal.
Your Dividend Portfolio Results
Ending Balance
$0.00
Cumulative Dividends
$0.00
Dividend Income (Year 20)
$0.00
Ending Dividend Yield
0.00%
Loading chart
Year
Starting Balance
Annual Dividend
Dividend Yield
Yield on Cost
Tax Amount
Annual Contribution
Principal
End Balance
No data available
Want to track all your dividends in one place?
Try Portseido for free, no credit card required.
How to use dividend calculator?
Welcome to our Dividend Income Calculator, a powerful tool designed to help you plan and visualize the growth of your dividend portfolio over time. By inputting various parameters related to your investment strategy, you can gain valuable insights into your potential future wealth, cumulative dividends, and dividend yield. Follow the steps below to make the most of this tool.
Understanding your inputs:
Part 1: Initial Portfolio Setup
1. Time Horizon
Define the time period for which you want to project your investment outcomes. This is the duration over which you anticipate the growth of your portfolio. It could be a specific number of years or a milestone like retirement.
2. Starting Principal
This is the initial capital that you have available for your investment portfolio.
Part 2: Contribution
3. Additional Contribution
Specify the value and frequency of any additional contributions you plan to make. This could include regular contributions beyond the initial investment, reflecting your ongoing commitment to building your portfolio.
4. Contribution Growth
Define the growth rate and frequency of your additional contributions. This parameter allows you to account for any anticipated increases in the amount or frequency of your future contributions.
Part 3: Dividend and Return Assumptions
5. Initial Dividend Yield
Input the current status of the dividend yield for your investments. The dividend yield represents the annual dividend income as a percentage of the investment's current market price.
6. Annual Price Growth
Specify the expected capital appreciation rate. This is the anticipated annual increase in the value of your investments due to market price growth.
7. Annual Dividend Yield Growth
This parameter accounts for the potential increase in the dividend yield over time.
8. Dividend Growth Rate
Input the rate at which you expect your dividends to grow over time. This reflects the expected annual increase in the absolute amount of dividends paid.
9. Max Dividend Yield
Specify the maximum dividend yield that you anticipate. This allows you to set an upper limit on the dividend yield, providing a realistic boundary for your projections.
10. Dividend Tax Rate
Input the applicable tax rate on your dividends. This parameter helps in calculating the after-tax returns on your dividend income.
11. Dividend Reinvestment Plan (DRIP)
Indicate whether you plan to participate in a Dividend Reinvestment Plan. If you choose to reinvest your dividends, they will be used to purchase additional shares, potentially compounding your returns.
Understanding the Output
Ending Wealth
The projected value of your portfolio at the end of the specified time horizon.
Cumulative Dividend
The total sum of dividends received over the investment period.
Dividend at the End of the Plan
The expected dividend yield at the conclusion of the investment plan.
Dividend Yield
The average dividend yield over the investment period.
What are the most important metrics for dividend stocks?
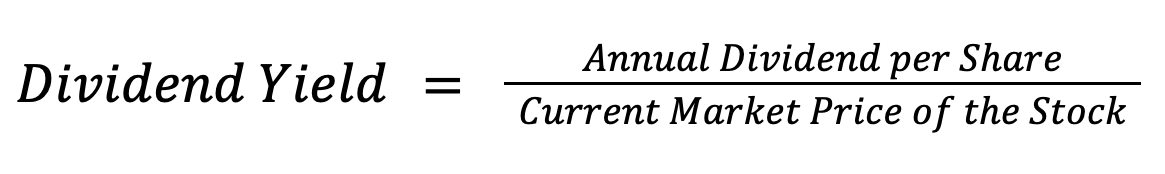
1. Dividend Yield
Dividend yield is one of the most fundamental metrics for dividend investors. It measures the annual dividend income generated by a stock relative to its current market price. To calculate dividend yield, use the following formula:
For example, if a stock pays an annual dividend of $2 and is currently trading at $50 per share, the dividend yield would be 4% ($2 / $50). A higher yield is generally preferable, but it's essential to consider other factors such as the company's financial health and growth potential.
2. Dividend Growth
Dividend growth is another important metric that indicates the consistency and sustainability of a company's dividend payments. Successful dividend investing is not just about high yields but also about a company's ability to increase its dividend over time. Companies that consistently raise their dividends demonstrate a healthy balance between investing in growth and returning profits to shareholders.
When evaluating dividend growth, consider the company's track record of increasing dividends annually. Look for companies with a history of steady, reliable, and sustainable dividend growth like Dividend Aristocrat, which are companies that have increased dividend payments for at least 25 consecutive years, or Dividend King, which have done so for even longer period of 50 consecutive years
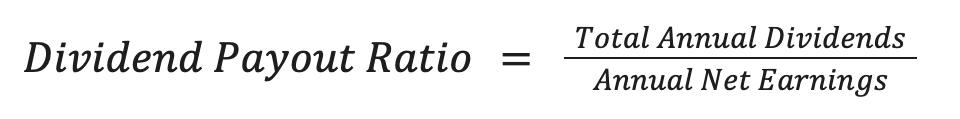
3. Payout Ratio
The payout ratio is a metric for assessing the sustainability of dividend payments. It indicates the portion of a company's earnings paid out as dividends. A lower payout ratio suggests that the company has room to continue or increase its dividend payments.
A low payout ratio, typically below 60%, indicates that the company retains a significant portion of its earnings for reinvestment or future dividends. Be cautious of companies with high and increasing payout ratios, as they may struggle to maintain or increase their dividends going forward.
4. Free Cash Flow
Free cash flow is another metric for dividend investors to look at. It measures the cash a company generates after covering its operating expenses and capital expenditures. Healthy free cash flow with the good payout ratio above indicates that a company has the financial resources to sustain and potentially grow its dividend payments.
A company's ability to generate consistent free cash flow is essential for dividend sustainability. Be sure to analyze whether the company's free cash flow consistently exceeds its dividend payments, allowing room for potential dividend increases.
5. Monthly Dividend Income
For dividend investors looking to create a recurring income, tracking monthly dividend income is very useful. This metric helps you monitor your progress towards achieving your financial goals and maintaining a steady income flow.
Consider creating a spreadsheet or using investment tracking tools to keep a record of your monthly dividend income. This information can guide your investment decisions and help you adjust your portfolio to meet your income targets.
6. Portfolio Yield
Portfolio yield is the average yield of all the stocks in your dividend portfolio, providing a holistic view of the income your portfolio generates. To calculate the portfolio yield, sum the annual dividend income from all your holdings and divide it by the total portfolio value.
This metric helps you evaluate the overall performance and income potential of your portfolio. It is important to note that while a higher yield might be better, you shouldn't fall for the trap of "chasing yield" while sacrificing the quality of the underlying companies. Make sure to look at all the metrics mentioned above to gauge if this level of yield is sustainable.
7. Yield on Cost
Yield on cost is a unique metric for dividend investors that assesses the annual dividend income generated based on the initial investment cost. To calculate yield on cost, divide the current annual dividend income by your initial investment cost.
Yield on cost is an essential metric for long-term investors, as it demonstrates the actual return on your investment over time. As a stock's dividend grows, the yield on cost increases, highlighting the benefit of holding investments for the long haul.