Portfolio Performance Evaluation - Metrics to Use
Article last updated: April 24, 2024

One of the most important things but mostly overlooked in investing is evaluating how well your investments are doing. It's like checking a map to make sure you're on the right path. In this article, we'll look at why evaluating portfolio performance matters, what it aims to achieve, and the key measures used to understand both risk and return.
Why Evaluate Portfolio Performance?
Checking how your portfolio is performing helps you see if your investments are meeting your goals. Whether you're new to investing or experienced, regularly assessing your portfolio's performance helps you make better decisions and improve your investment strategy.
Goals of Portfolio Performance Evaluation
There are two main sides in investing regardless of the strategy in use. One is return. The other one is risk. Therefore, the main goal of portfolio evaluation is to see how well your investments are balancing risk and return. This involves looking at three main things: how much you're making (return), how risky your investments are (risk), and how well your returns justify the risks you're taking (risk-adjusted return). So, in this article, we are going through important metrics for each one of these aspects.
Return Metrics
Return metrics show how much money your investments are making over time. Here are some common return metrics:
Total Return
This is the total gain or loss from your investments including capital gains from price appreciation and the distributions or payments received from the investment such as interests and dividends over initial investment. In most of the cases, total return usually refers to Simple Return. However, there are multiple ways in calculating total return.
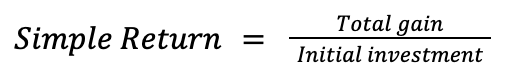
Simple Return (SR)
This is the basic percentage change in your investment's value. We can calculate simple returns by dividing the total gains by initial investment.
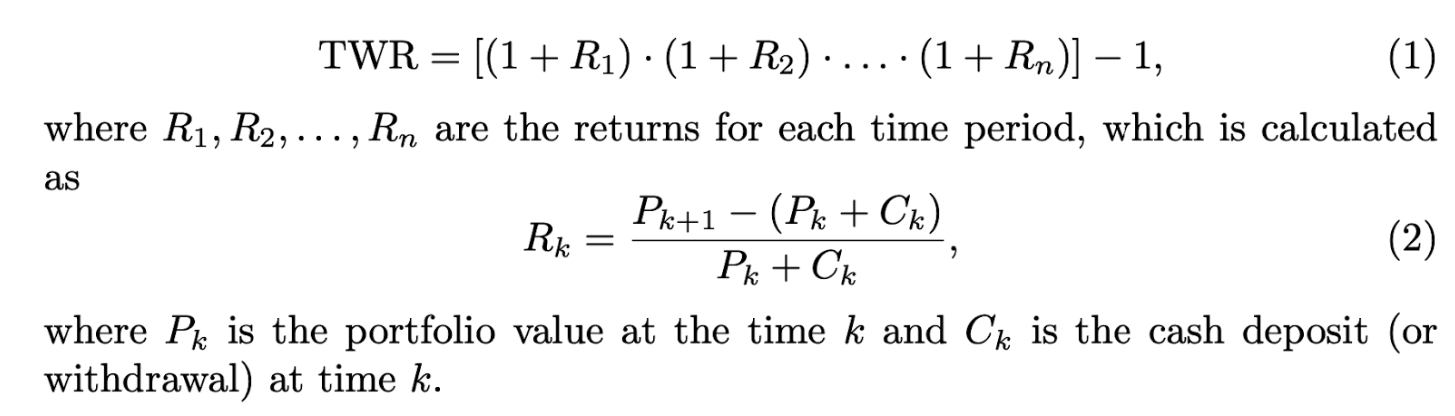
Time-Weighted Return (TWR)
On the other hand, simple return is not a good metric to measure investment return when there is multiple cash flow into or out of the portfolio. Time-weighted returns solve the problem by accounting for the timing of your investments to calculate the average return.
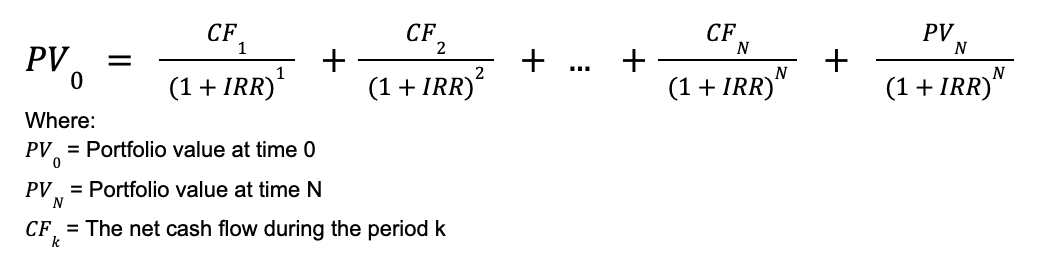
Money-Weighted Return (MWR)
Time-weighted return method also has its drawback mainly because it ignores the “size” and gives an equal weight to each sub-periods. This means your return figures can be misleading when there is a large cash inflow or outflow of the portfolio. Money-weighted return takes a step further by taking into account both time and size. Money-Weighted Return is calculated by solving for a rate of return that equates the current portfolio value to the net present value or discounted value of all future cash flows.
Excess Return
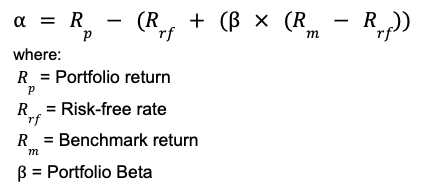
Alpha (α)
Alpha (α) is a measure of the excess return of an investment relative to the expected return of a portfolio as determined by the capital asset pricing model (CAPM).
Risk Metrics
Risk metrics help you understand how risky your investments are. Here are some key risk metrics:
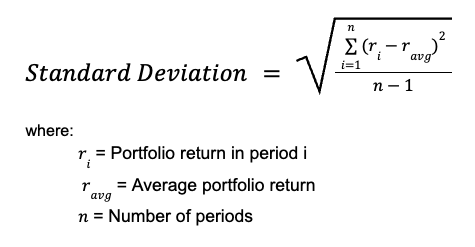
Standard Deviation of Returns
This shows how much your investment returns vary over time, indicating volatility. This approach quantifies the risk by measuring how volatile the return of the investment is. Its rationale is that if two investments have the same average return, the one with more certainty on the return is a less risky one. For example, if stock A has an average return of 10% with 9% return in period 1, 10% in period 2 and 11% period 3 and stock B has the same 10% average return but with 0% return in period 1, 10% in period 2 and 20% in period 3, stock B is riskier than stock A.
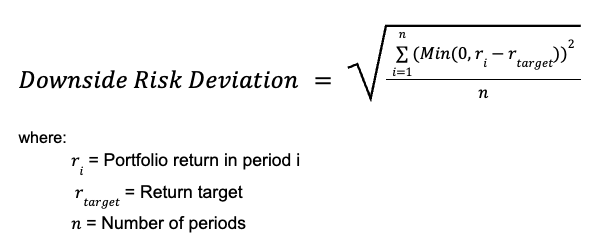
Downside Risk Deviation
One of the downsides of standard deviation of return is that it penalizes all the positive returns too. This means, even if the portfolio has positive returns in all the periods, they all get penalized by the metrics too. Downside Risk Deviation solves this problem by focusing only on returns that fall below the minimum threshold return.
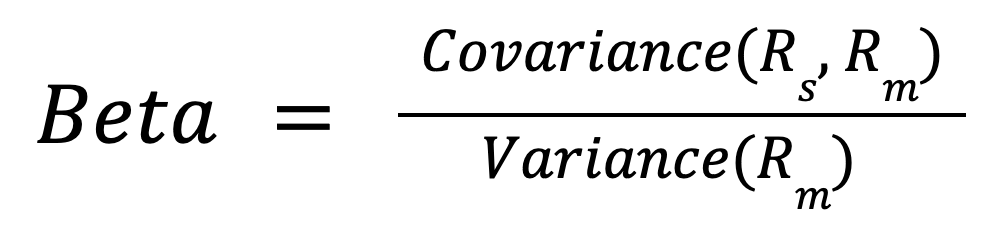
Beta (β)
Beta (β) is one of the risk measurements for a stock or portfolio by measuring the volatility of the asset or portfolio compared to the market. This approach quantifies how much the investment return will be given the benchmark return. For example, if Beta is equal to 2, if the benchmark is up x% in a period, it on average will go up 2 times as much.
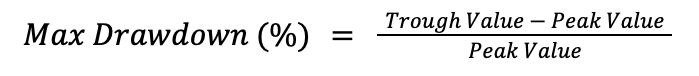
Maximum Drawdown
Maximum Drawdown is the biggest decline of investment value from the peak to the trough value which is typically measured in percentage value. It is used to infer the downside risks of an investment. Many investors consider risk as the permanent loss of capital, and maximum drawdown is one metric that has the nearest definition to that.
Challenges with Risk Measurements
While risk metrics are useful, they don't always tell the whole story. Some of these metrics quantify an underlying investment's volatility relative to its benchmark, which might not fully capture its risk profile. All of these are also lagging metrics which means they represent the historical performance, but they might not indicate the real current level of risks. For example, a portfolio might start with no leverage at all making these risk metrics to be low. However, by using more leverage now, it is clearly more risky, but these metrics are not yet capturing that.
Risk-Adjusted Return
This attempts to capture both risks and returns by combining them in the metrics. The concepts of the following metrics are quite similar in that they try to capture how much return the portfolio generates per one unit of risk. However, the returns and risks used may differ.
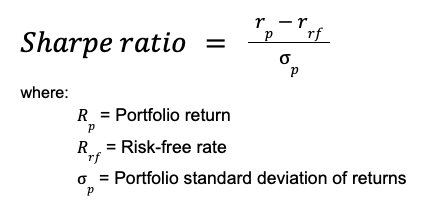
Sharpe Ratio
Sharpe ratio measures how much extra return you're getting per unit of risk by using standard deviation of returns as risk and return over risk-free rate as extra return from taking more risk over the risk-free asset.
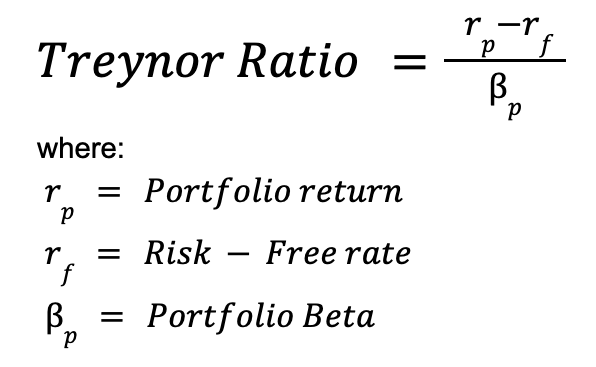
Treynor Ratio
Treynor ratio is almost the same as Sharpe ratio but, instead of standard deviation of return, it uses Beta as the risk measurement.
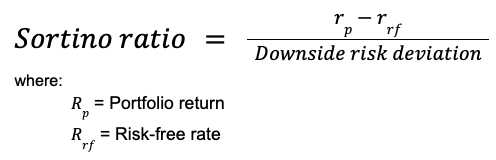
Sortino Ratio
Sortino ratio is a modification of Sharpe ratio by adjusting the risk part of it. Instead of using standard deviation of return, it uses downside risk deviation.
Evaluating Portfolio Performance in Real Life
Evaluating portfolio performance is key to making informed investment decisions. In the real world, assessing your investments can be difficult. Calculating these metrics and monitoring over time can be difficult and time consuming. So many have used tools like Google Spreadsheet, Excel and other portfolio trackers in keeping track of investments. We really encourage you to give Portseido a try. It’s always our goal to help investors around the world to keep track of their investments and track their portfolio performance. So you can become a better investor and achieve your financial success over time.