Drawdown definition and what it means to investors
Article last updated: November 1, 2023
Drawdown is one of the most important metrics in measuring risk of your investment strategy. While it is useful to track such metrics, it is not a good practice to react to it in an emotional way which might ruin your portfolio returns. In this article, we discuss what drawdown is, how intelligent investors can learn from it and what investors should expect during the crash. If you find this article helpful, don’t forget to share it with your fellow investors. If you also think that tracking this is useful and you want to track it regularly and effortlessly, visit us at Portseido.
What is Drawdown?
Drawdown is a decline of investment value from the peak which is typically measured in percentage value. It is used to infer the downside risks of an investment. Many investors consider risk as the permanent loss of capital, and drawdown is one metric that has the nearest definition to that.
What is Maximum Drawdown?
Maximum Drawdown (MDD) represents the largest percentage decline in an investment's value over a specific time frame. It measures the biggest drop from a peak to a subsequent trough. MDD is a crucial indicator as it shows the worst-case scenario for an investor who bought at the highest point and sold at the lowest point. This metric is particularly relevant during economic downturns, as significant drawdowns often coincide with recessions.
Maximum Drawdown Calculation
Drawdown Formula
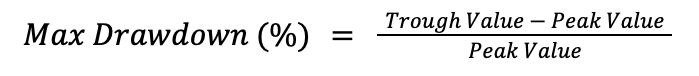
Max Drawdown Calculation Example
From the table above, we can calculate the maximum drawdown value by finding the peak values and their following trough values. Then calculate the drawdown of each pair and find the largest drop in value. In this case,
MaxDrawdown = 1060 - 1230 / 1230 = -13.82%
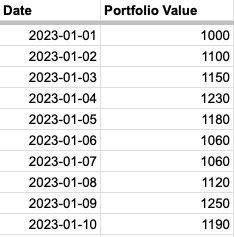
Maximum Drawdown Calculation in Spreadsheet
Using the same example above, we can calculate drawdown by using historical portfolio value.
- Calculate Peak Value of each period using "MAX" function
MAX(Current Value, Previous Peak Value)
- Compute Drawdown (%) at each period
(Current Value - Peak Value) / Peak Value
- Get Max Drawdown by applying "MIN" function to all Drawdown (%) column (Using MIN because the value is in negative number)
Tracking Drawdown
While tracking drawdown can be beneficial to improve one’s investment skill, it can be disastrous if investors are emotionally attached to it. Watching an investment drop down 50% from $100k to $50k can be very painful, and we can guess what emotional investors might do next.
“Panic Selling”
Avoiding panic is easier said than done. In this case, we will approach this by expectation management. Thus, the question is what the investors should expect during the downturn, and why it is normal to face such a drawdown. By setting an appropriate expectation, we believe that investors can relieve such pain easily although avoiding all the pains might be difficult.
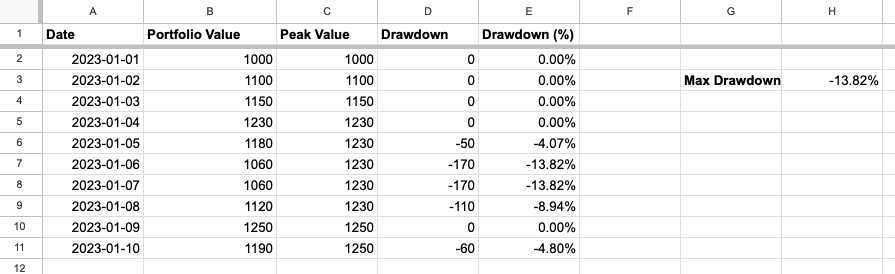
Example of a Drawdown
It’s the fact that we cannot avoid drawdowns, so it is the matter of how much. Historically, over the past 29 years, SPY (SPDR S&P 500 ETF Trust) has had an annualized return of 8.87%. This means an investment of $10,000 on SPY during such a period will result in $117,100 today (2022–02–15) or 1071% total return.
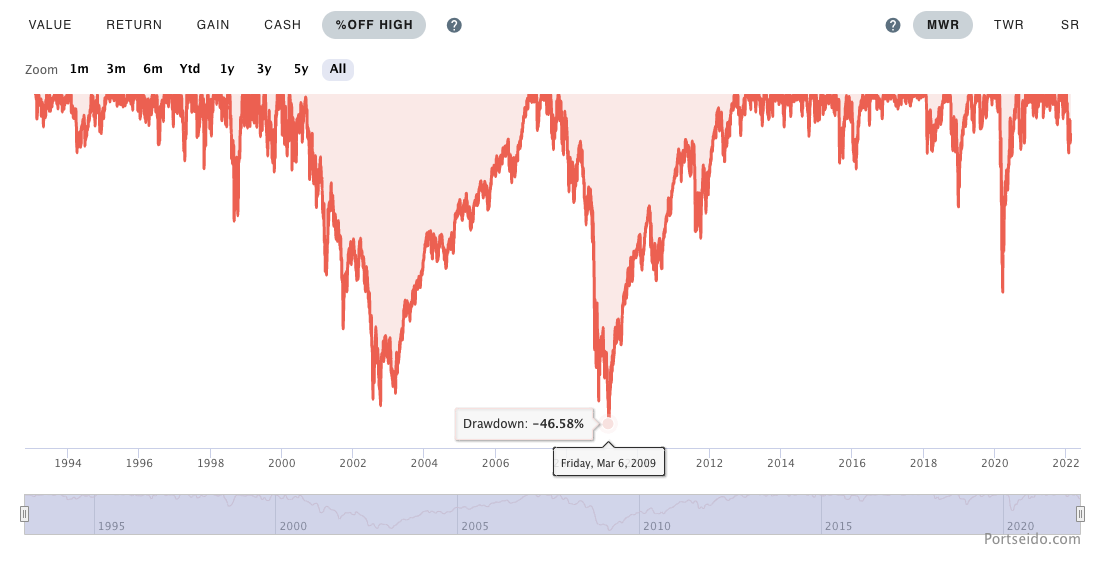
You might see this kind of stats many times before, but what it does not tell us is during such time you also faced your investment being halved once, being down more than 30% for 3 times and also being down more than 10% for 12 times. This means while investors investing in S&P 500 might expect an annualized return of 8.87% over the long term, the investors should also expect that it is typical to see an investment at any given time being down more than 40% once over 15 years, more than 30% once every decade and more than 10% every 2.5 year.
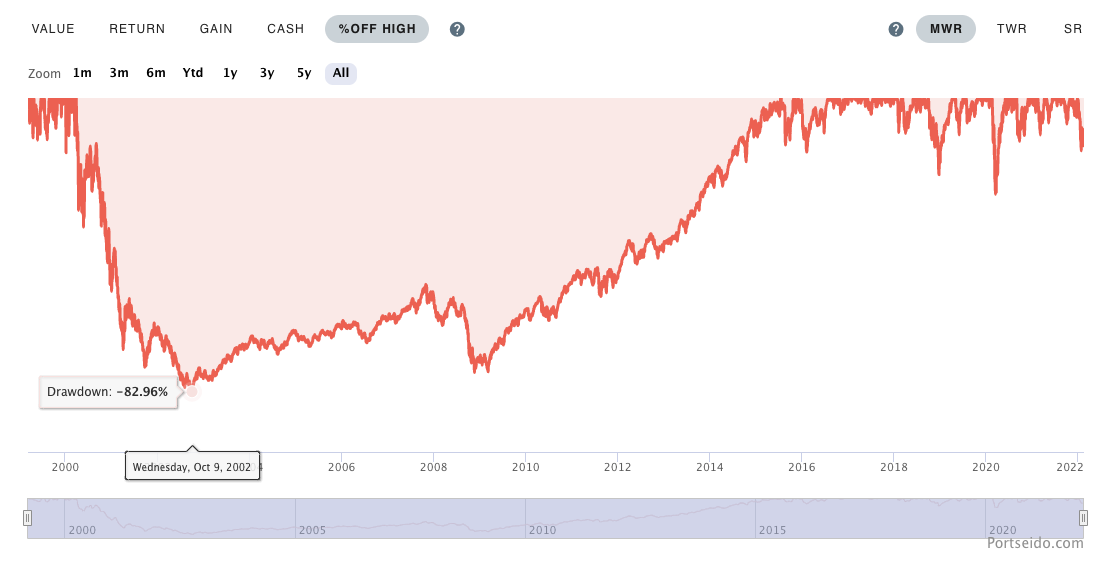
QQQ (Invesco QQQ Trust which tracks the Nasdaq-100 Index) did even worse on the drawdown. Over the past 22 years, although it has had an annualized return of 12.42% (a total of 1356%), it dropped 82.96% in just 2.5 years, and it took almost 13 years to get back the value that has been wiped out.
Although the future might not repeat what we saw in the past, it is still a good proxy for setting our own expectations on the downside. By using this expectation and gauging investors’ own risk appetite, investors can choose a suitable investment style to fit with such needs too. If the investor’s strategy is more aggressive (e.g. growth investing), the expected drawdown might be higher during the downturn as well as the expected return during the bullish market. On the other hand, if it is more conservative (e.g. value investing), while the expected return might not be as high as the more aggressive strategy during the bull run, the drawdown should be expected to be lower.
What to do instead?
Think and act intelligently. Although we should track drawdown as a proxy of how much risk we took in our strategy, we should not panic on the figure. Every decision should be justified with reasonable and thorough thinking. This applies to all situations whether you are in the bullish market or bearish market.
Learn from it. At Portseido, we always believe that, in any given situation, there is an opportunity to learn. Every investor makes mistakes, for example investing in overleveraged businesses, investing in low moat and unsustainable growth businesses, overly optimistic expectations during the bubble, etc. However, the thing that differentiates great investors from the others is how such mistakes are dealt with. Learning from such mistakes and being a better investor little by little every day is just like compounding interest. You might not feel the difference today, but it makes a huge difference in the long run.
Happy investing!