Cathie Wood ARK Portfolio Analysis 2025
Article last updated: December 23, 2025
Cathie Wood and ARK Invest: The Visionary Behind the Disruption
Cathie Wood is more than an investor; she's a futurist. Since founding ARK Investment Management in 2014, she has built a reputation for spotting tomorrow's winners before the market catches on. Her flagship fund, the ARK Innovation, became a household name during the pandemic boom with enormous returns. But like all active managers, Wood has faced challenges during the downturn that comes afterwards. Her strategy offers crucial lessons for investors to learn from.
This episode will mirror the structure of our Warren Buffett deep dive, but focused on ARK’s flagship strategies, using Portseido to analyze performance, holdings, and risk. Just a small spoiler that her portfolio is a stark contrast to the steady, value-oriented approach of the previous episode.
Disclaimer: This analysis is based on publicly available 13F data from 2017-2025. Trade dates and prices are estimated at quarter-end. Some tickers may be missing. The actual dollar value must be multiplied by 1 million for real scale.
1. The Overview: A Tale of Two Returns (TWR vs. MWR)
When we log into Portseido and view the Home dashboard for the ARK Investment Portfolio, we immediately encounter a fascinating discrepancy that perfectly illustrates the danger of "chasing performance."
As of the current snapshot, the portfolio value sits at $15,522. However, the real story lies in the massive gap between the Time-Weighted Return (TWR) and Money-Weighted Return (MWR).
- Time-Weighted Return (TWR): +233.28%
What this tells us: If an investor had put a lump sum in at the very beginning and never touched it, the strategy itself actually performed incredibly well over the long term. The stock picks, in isolation, generated massive growth.

- Money-Weighted Return (MWR): -34.97%
What this tells us: This metric accounts for cash inflows and outflows. The stark drop to -35% suggests that the bulk of the capital flowed into this portfolio after the massive gains had already happened. This is what people may call "buying the top."
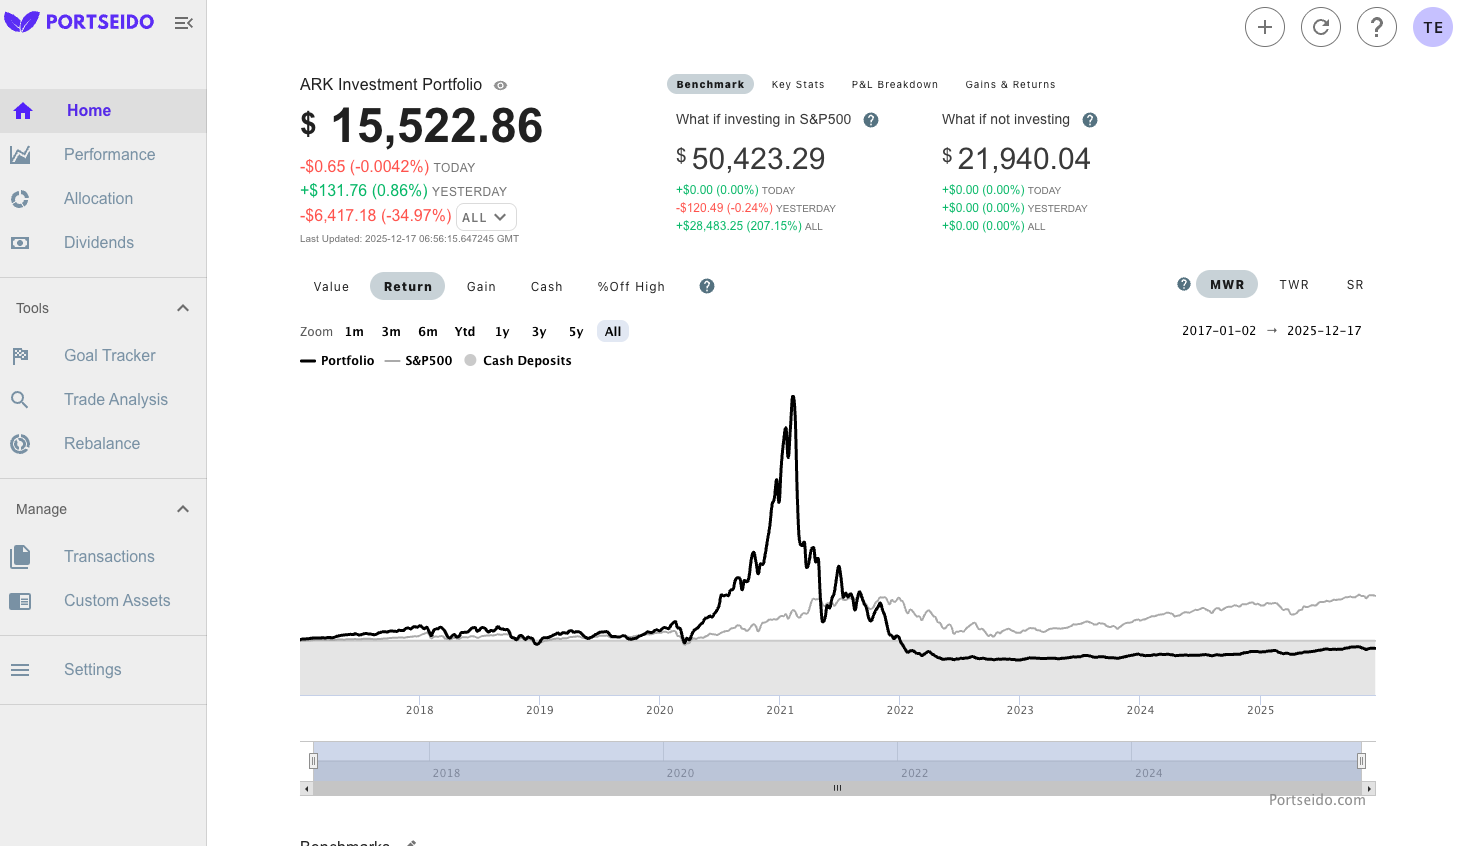
The "What If" Reality Check: Portseido's benchmarking tool further highlights the opportunity cost of this volatility.
💡💡 If this same capital had been deployed into the S&P 500 during the exact same timeframe, the outcome would have been drastically different:
- Projected S&P 500 Value: $50,423.29
- S&P 500 Return: Approx. +207.15% (MWR basis)
This divergence between TWR and MWR is a classic lesson of hype-driven investing: the strategy worked early on (high TWR), but most investors arrived too late to benefit (negative MWR), ultimately trailing the steady S&P 500 benchmark by a wide margin.
2. Performance: Boom or Bust
The journey of Cathie Wood's portfolio tells a compelling story of boom, bust, and resurgence. The data tracked through Portseido reveals a striking pattern of performance across market cycles. The "Historical Return" table in Portseido highlights a journey of extreme highs and significant drawdowns, characterized by sharp divergence from the S&P 500.
The Annual Performance Breakdown (MWR) allows us to track the yearly momentum of the portfolio against the market benchmark:
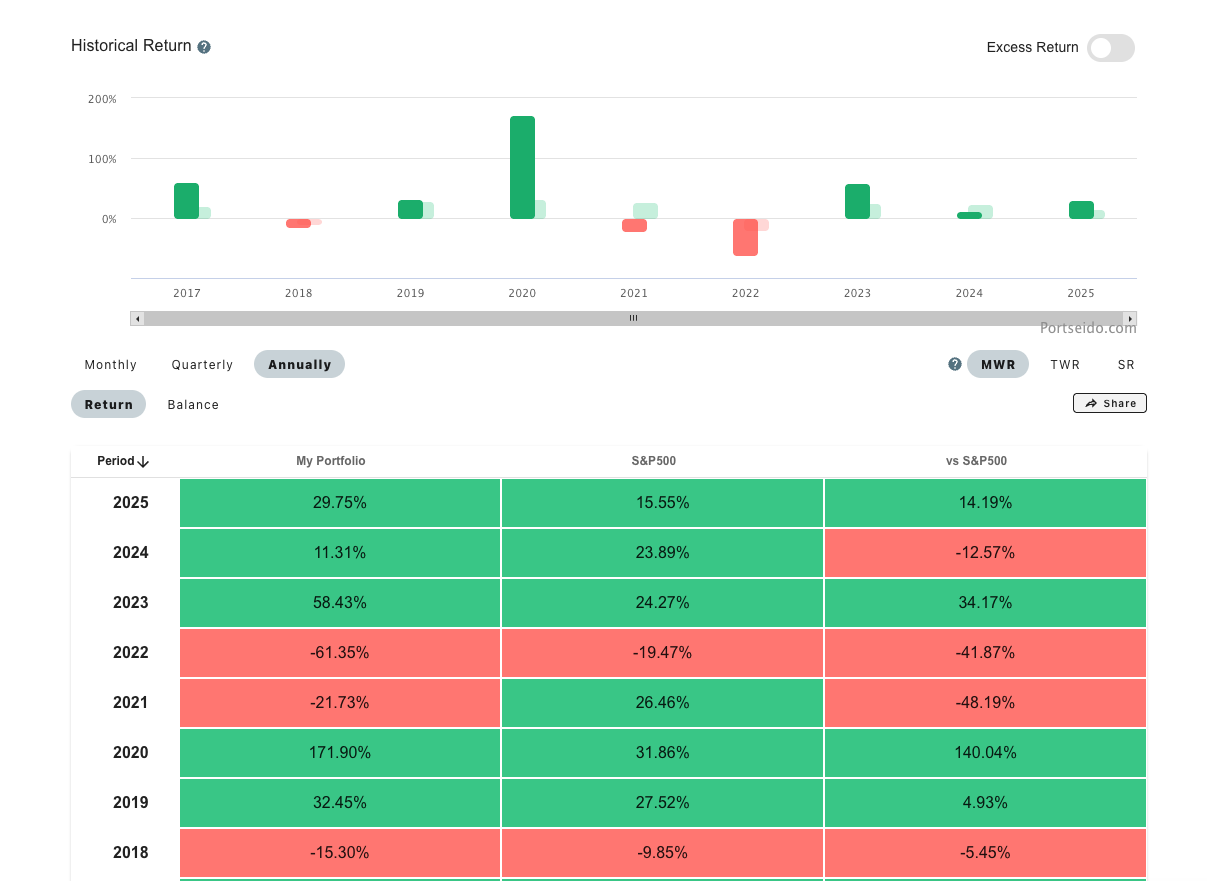
- 2020: The Breakout. A massive year for disruptive innovation, fueled by liquidity during the pandemic. The portfolio returned +171.90%, outperforming the S&P 500 by a staggering 140.04%.
- 2021: The Initial Slide. The momentum shifted as the portfolio dropped -21.73%, while the S&P 500 climbed +26.46%.
- 2022: The Crash. A crushing year for growth stocks resulted in a -61.35% return, underperforming the benchmark by -41.87%.
- 2023: The Recovery. A strong rebound saw the portfolio gain +58.43%, significantly outpacing the S&P 500’s +24.27%.
- 2024: Stability. The portfolio continued to grow with an +11.31% return, though it trailed the S&P 500’s +23.89% during this period.
- 2025 (YTD): Current Momentum. As of the latest data in 2025, the portfolio is up +29.75%, currently beating the S&P 500’s +15.55%.
This historical view visualizes the high-beta nature of the ARK strategy. While the portfolio is capable of massive outperformance in favorable environments when tech and innovation regained investor attention (like 2020 and 2023), it also faces deep corrections that can take years to recover from. For index investors, smaller drawdowns mean faster recoveries like a 20% decline recovers in months during bull markets, but a 60% decline requires years of exceptional outperformance just to catch up.
The Portseido benchmark analysis provides crucial context on how Wood's portfolio performs relative to major market indices:
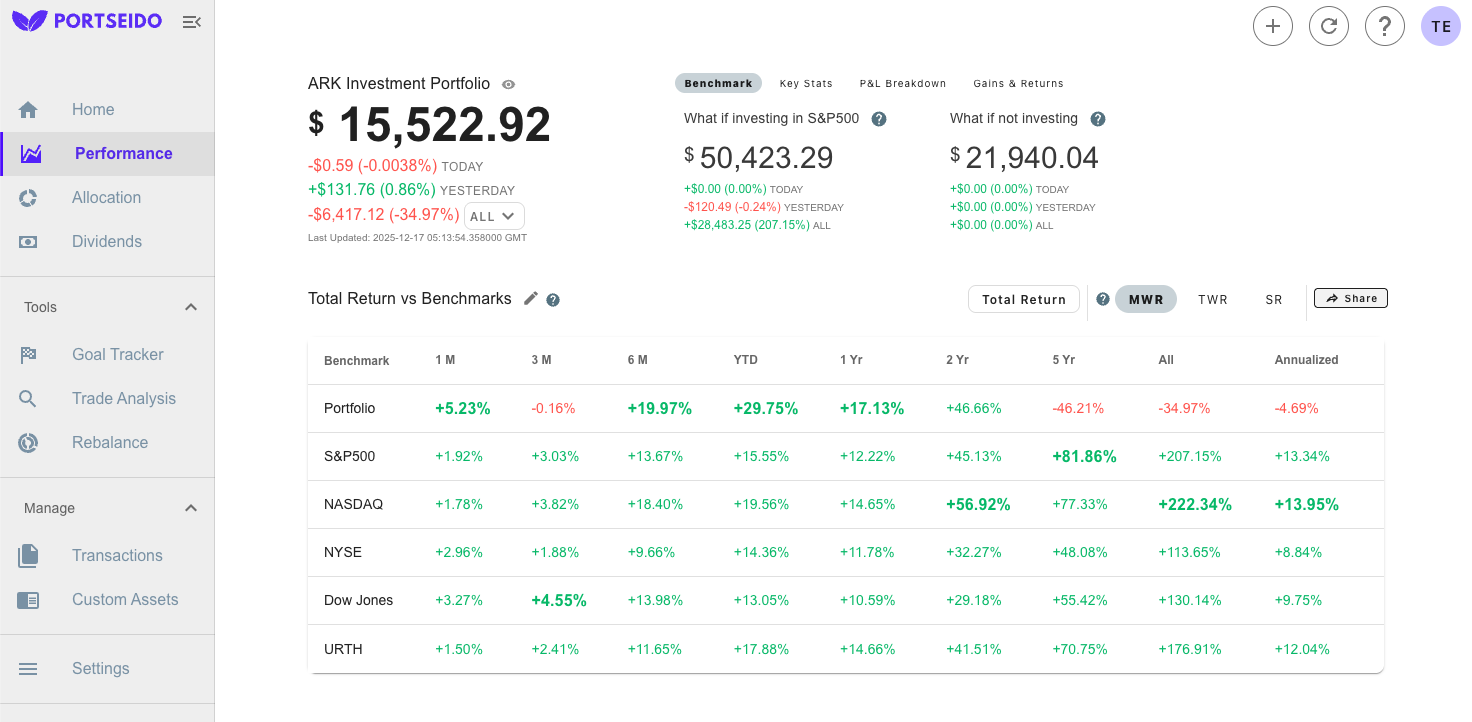
The data shows that ARK underperformed NASDAQ (more growth-focused) but outperformed the broader S&P 500. This reflects the positioning: ARK is more concentrated in select growth themes than the diversified NASDAQ but avoids the value and defensive stocks in the S&P 500.
3. Portfolio Allocation: Betting on the Future
What does a portfolio focused on "disruptive innovation" look like? The Allocation tab breaks it down by sector and weight.
Sector Breakdown: Unsurprisingly, the portfolio is heavily weighted toward technology and sectors that intersect with it:
- Technology: 35.8% (The dominant force)
- Healthcare: 21.9% (Likely genomics and biotech)
- Consumer Cyclical: 13.6%
- Communication Services: 10.1%
Top Holdings: Looking at the specific assets, we see high conviction bets. Portseido shows that the top holdings make up a significant chunk of the portfolio, indicating a concentrated strategy:
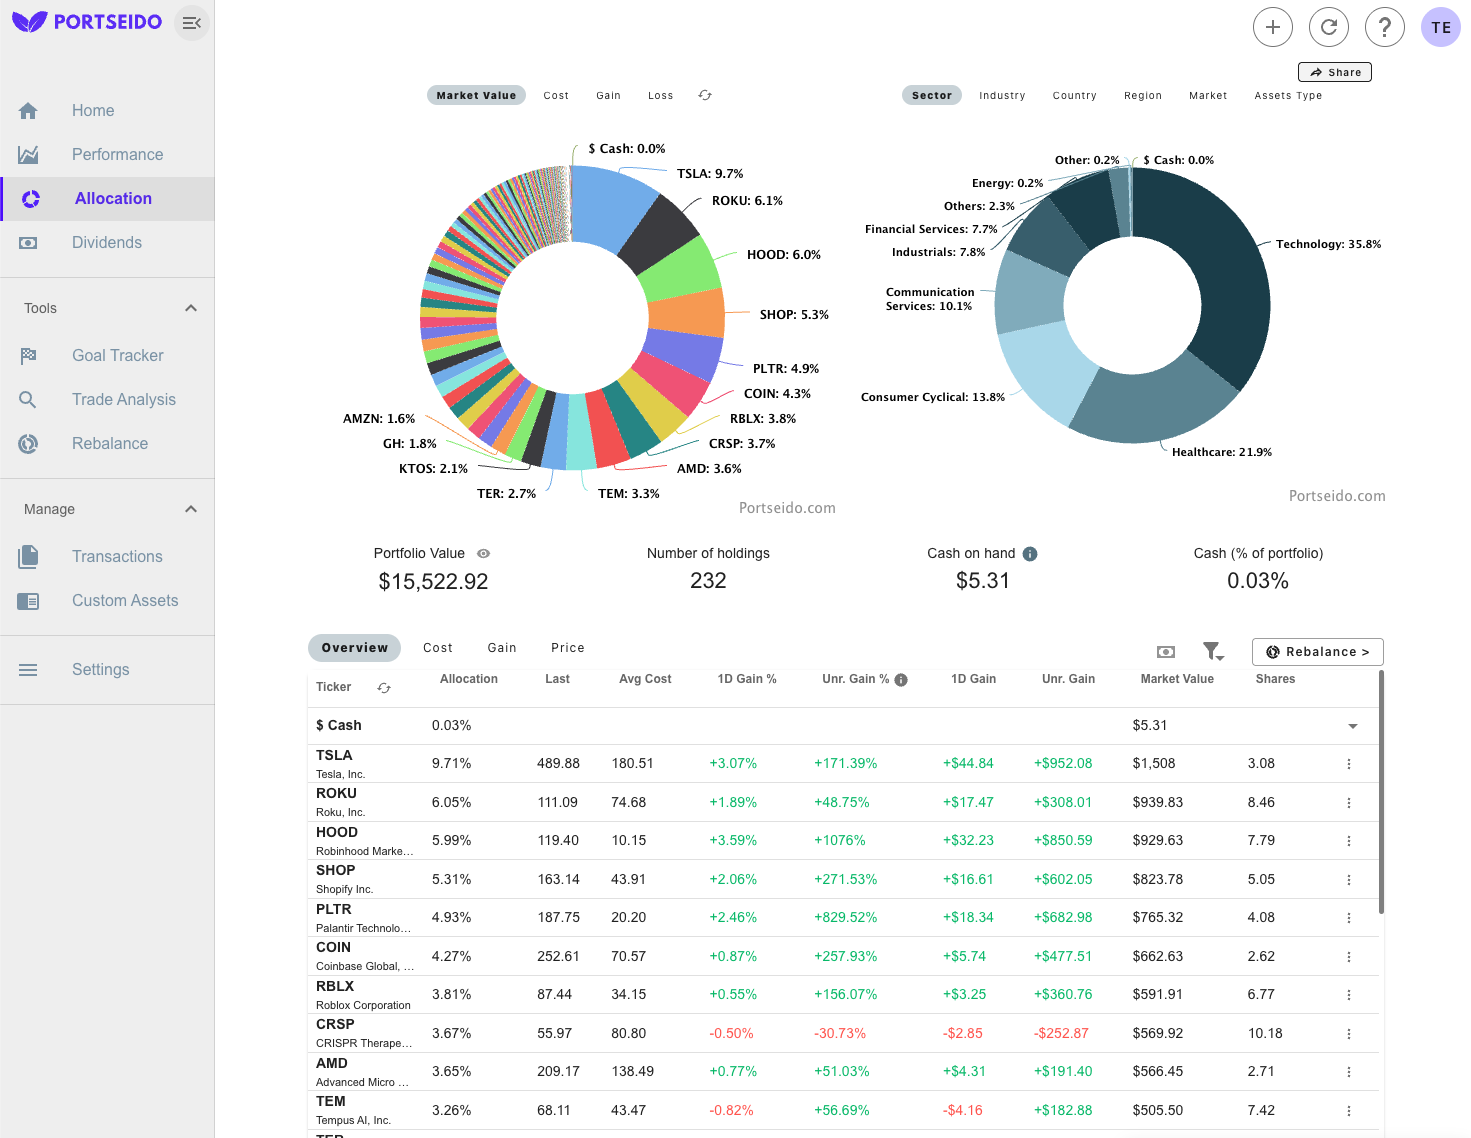
The portfolio holds a focused set of high-conviction names.
- Tesla (TSLA) — 9.71%
- Roku (ROKU) — 6.05%
- Robinhood Markets (HOOD) — 5.99%
- Shopify (SHOP) — 5.31%
- Palantir Technologies (PLTR) — 4.93%
- Coinbase (COIN) — 4.27%
- Roblox (RBLX) — 3.81%
- CRISPR Therapeutics (CRSP) — 3.67%
- Advanced Micro Devices (AMD) — 3.65%
- Tempus AI (TEM) — 3.26%
The top 10 holdings represent approximately half of the portfolio, indicating significant concentration in core conviction themes while maintaining broader diversification across more than 200 holdings.
4. Uncovering True Alpha: Stock Selection in Action
Analysis of individual holdings shows which bets generated exceptional returns:
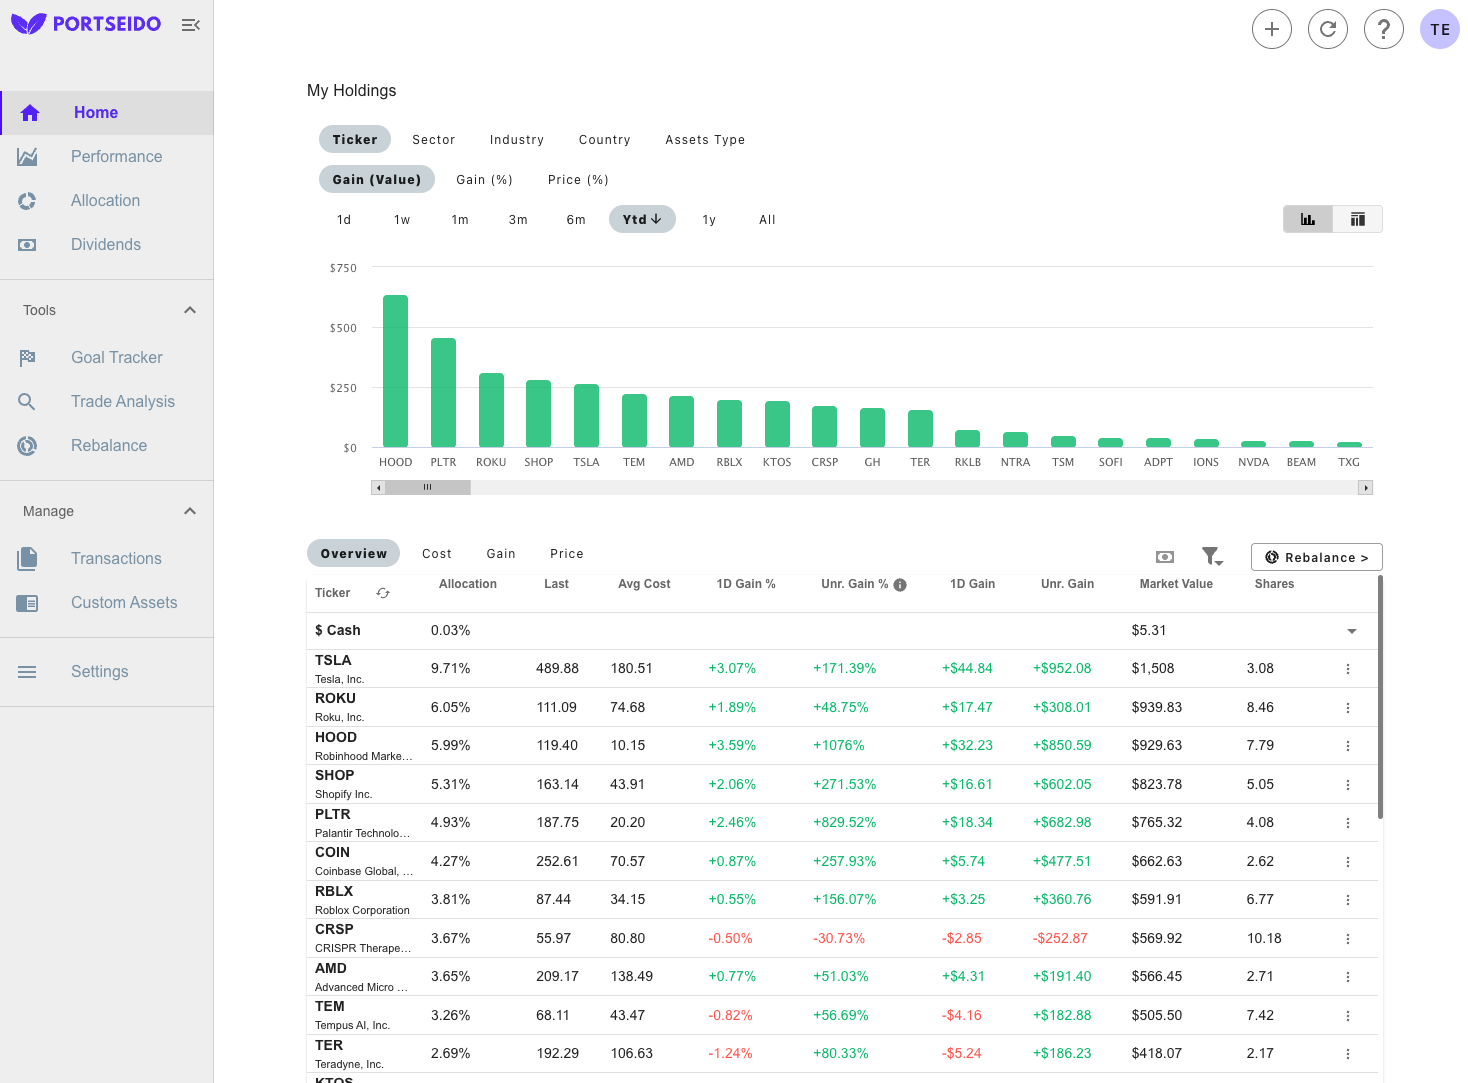
- Robinhood (HOOD): Unrealized Gain of +1,076% (from avg cost $10.15 to current $119.40) This position exemplifies Wood's conviction. Despite skepticism, Robinhood proved its business model and has become a flagship fintech holding.
- Palantir (PLTR): Unrealized Gain of +829.52% (from avg cost $20.20 to current $187.75) Early bet on AI-powered data analytics before mainstream adoption.
- Shopify (SHOP): Unrealized Gain of +271.53% (from avg cost $43.91 to current $163.14) E-commerce platform benefiting from digital retail acceleration especially from the pandemic years.
- Coinbase (COIN): Unrealized Gain of +257.93% (from avg cost $70.57 to current $252.61) Digital asset infrastructure positioning during crypto adoption waves.
- Tesla (TSLA): Unrealized Gain of +171.39% (from avg cost $180.51 to current $489.88) Despite recent volatility and media skepticism, Tesla remains solidly profitable at current levels.
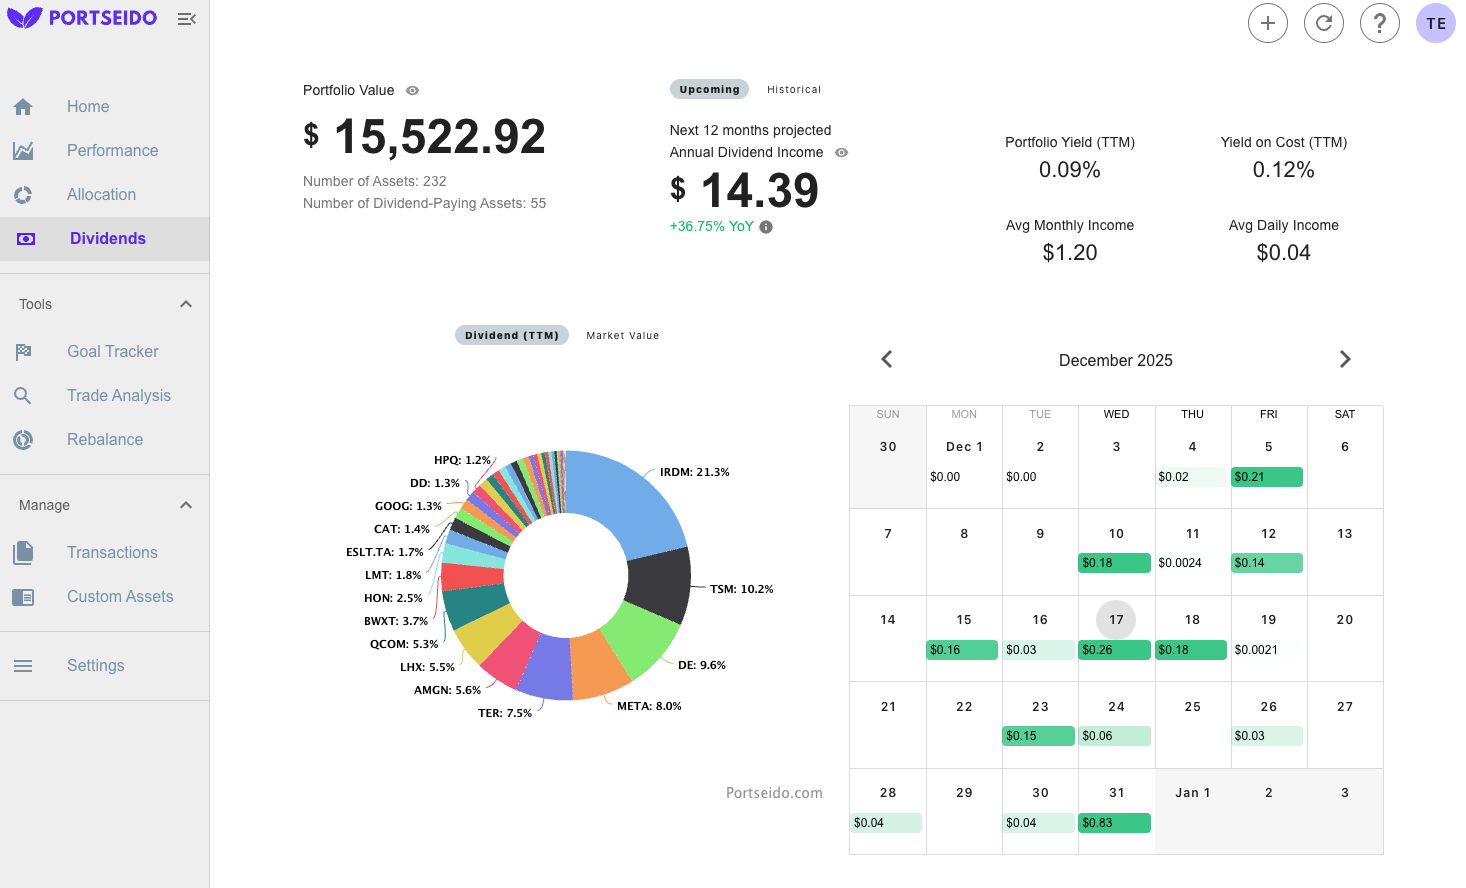
5. Dividends: Growth Over Income
One area where ARK sharply diverges from traditional dividend-focused strategies is income generation. This reflects Wood's philosophy: growth stocks that reinvest profits into innovation generate returns through capital appreciation, not income distribution. It's very clear that ARK is not a vehicle for passive income investors.
- Portfolio Yield (TTM): 0.09%
Conclusion: Lessons from ARK's Innovation Playbook
Analyzing Cathie Wood's portfolio through Portseido's data-driven lens reveals three critical lessons for all investors. The strategy is high-risk, high-reward, and highly volatile. Definitely it is not for everyone.
- Conviction and Discipline: The portfolio's -34.97% Money-Weighted Return requires conviction to maintain positions despite multi-year drawdowns.
- Top holdings drive returns: The 1,076% gain in Robinhood, 829% in Palantir, and 271% in Shopify drive portfolio performance more than the rest.
- The mathematical reality is unforgiving: ARK's 61% drawdown in 2022 required a 158% gain just to break even, while the S&P 500's 19% decline only needed 24% to recover.
Ultimately, the 2020-2025 data shows that this strategy underperformed diversified approaches, especially the S&P 500 index, on a multi-year basis, suggesting that mixing growth concentration with broader diversification may offer better risk-adjusted returns.
Frequently Asked Questions (FAQ)
What is Cathie Wood's portfolio performance in 2025?
As of 2025 year-to-date, Cathie Wood's ARK portfolio is up +29.75%, currently beating the S&P 500's +15.55%. However, while the Time-Weighted Return shows +233.28% since the start of logging, the Money-Weighted Return sits at -34.97%. Over the 2020-2025 period, the strategy underperformed the S&P 500 on a multi-year basis.
What are the top holdings in Cathie Wood's portfolio?
As of 2025, the top ten holdings are:
- Tesla (TSLA) — 9.71%
- Roku (ROKU) — 6.05%
- Robinhood Markets (HOOD) — 5.99%
- Shopify (SHOP) — 5.31%
- Palantir Technologies (PLTR) — 4.93%
- Coinbase (COIN) — 4.27%
- Roblox (RBLX) — 3.81%
- CRISPR Therapeutics (CRSP) — 3.67%
- Advanced Micro Devices (AMD) — 3.65%
- Tempus AI (TEM) — 3.26%
The top 10 holdings represent approximately half of the portfolio, indicating significant concentration in core conviction themes while maintaining broader diversification across more than 200 holdings.
Does Cathie Wood beat the S&P 500?
Cathie Wood's ARK strategy has underperformed the S&P 500 on a multi-year basis (2020-2025). While the portfolio showed exceptional returns in certain years (like +171.90% in 2020 and +58.43% in 2023), the Money-Weighted Return of -34.97% significantly trails the S&P 500's approximate +207.15% return over the same period, illustrating the danger of chasing performance after gains have already occurred.
What can investors learn from Cathie Wood's strategy?
Cathie Wood's portfolio reveals that the strategy is high-risk, high-reward, and highly volatile—definitely not for everyone. The portfolio's -34.97% Money-Weighted Return requires conviction to maintain positions despite multi-year drawdowns, while top holdings like Robinhood (+1,076%), Palantir (+829%), and Shopify (+271%) drive most of the performance. The mathematical reality is unforgiving: ARK's 61% drawdown in 2022 required a 158% gain just to break even, compared to the S&P 500's 19% decline that only needed 24% to recover.
Ready to analyze your own innovation-focused portfolio? Portseido helps you track performance, risk, and trades—just like in this ARK deep dive. Try it for free!
Happy Investing!